Mudanças entre as edições de "Sandbox"
m (Vamos ver agora) |
(Teste de Gráficos (mas falta implementar a Predefinição)) |
||
| Linha 7: | Linha 7: | ||
* [[:Especial:Predefinições não categorizadas]] | * [[:Especial:Predefinições não categorizadas]] | ||
* [[:Categoria:Predefinições]] | * [[:Categoria:Predefinições]] | ||
| − | |||
'''Listas:''' | '''Listas:''' | ||
| Linha 120: | Linha 119: | ||
| Example || Example || Example | | Example || Example || Example | ||
|} | |} | ||
| + | |||
| + | == Gráficos == | ||
| + | |||
| + | Teste de gráficos com JSON. | ||
| + | |||
| + | <graph> | ||
| + | { | ||
| + | "width": 400, | ||
| + | "height": 200, | ||
| + | "padding": {"top": 10, "left": 30, "bottom": 30, "right": 10}, | ||
| + | "data": [ | ||
| + | { | ||
| + | "name": "table", | ||
| + | "values": [ | ||
| + | {"x": 1, "y": 28}, {"x": 2, "y": 55}, | ||
| + | {"x": 3, "y": 43}, {"x": 4, "y": 91}, | ||
| + | {"x": 5, "y": 81}, {"x": 6, "y": 53}, | ||
| + | {"x": 7, "y": 19}, {"x": 8, "y": 87}, | ||
| + | {"x": 9, "y": 52}, {"x": 10, "y": 48}, | ||
| + | {"x": 11, "y": 24}, {"x": 12, "y": 49}, | ||
| + | {"x": 13, "y": 87}, {"x": 14, "y": 66}, | ||
| + | {"x": 15, "y": 17}, {"x": 16, "y": 27}, | ||
| + | {"x": 17, "y": 68}, {"x": 18, "y": 16}, | ||
| + | {"x": 19, "y": 49}, {"x": 20, "y": 15} | ||
| + | ] | ||
| + | } | ||
| + | ], | ||
| + | "scales": [ | ||
| + | { | ||
| + | "name": "x", | ||
| + | "type": "ordinal", | ||
| + | "range": "width", | ||
| + | "domain": {"data": "table", "field": "x"} | ||
| + | }, | ||
| + | { | ||
| + | "name": "y", | ||
| + | "type": "linear", | ||
| + | "range": "height", | ||
| + | "domain": {"data": "table", "field": "y"}, | ||
| + | "nice": true | ||
| + | } | ||
| + | ], | ||
| + | "axes": [ | ||
| + | {"type": "x", "scale": "x"}, | ||
| + | {"type": "y", "scale": "y"} | ||
| + | ], | ||
| + | "marks": [ | ||
| + | { | ||
| + | "type": "rect", | ||
| + | "from": {"data": "table"}, | ||
| + | "properties": { | ||
| + | "enter": { | ||
| + | "x": {"scale": "x", "field": "x"}, | ||
| + | "width": {"scale": "x", "band": true, "offset": -1}, | ||
| + | "y": {"scale": "y", "field": "y"}, | ||
| + | "y2": {"scale": "y", "value": 0} | ||
| + | }, | ||
| + | "update": { | ||
| + | "fill": {"value": "steelblue"} | ||
| + | }, | ||
| + | "hover": { | ||
| + | "fill": {"value": "red"} | ||
| + | } | ||
| + | } | ||
| + | } | ||
| + | ] | ||
| + | } | ||
| + | </graph> | ||
| + | |||
| + | <graph> | ||
| + | { | ||
| + | "width": 500, | ||
| + | "height": 200, | ||
| + | "padding": {"top": 10, "left": 30, "bottom": 30, "right": 10}, | ||
| + | "data": [ | ||
| + | { | ||
| + | "name": "table", | ||
| + | "values": [ | ||
| + | {"x": 1, "y": 28}, {"x": 2, "y": 55}, | ||
| + | {"x": 3, "y": 43}, {"x": 4, "y": 91}, | ||
| + | {"x": 5, "y": 81}, {"x": 6, "y": 53}, | ||
| + | {"x": 7, "y": 19}, {"x": 8, "y": 87}, | ||
| + | {"x": 9, "y": 52}, {"x": 10, "y": 48}, | ||
| + | {"x": 11, "y": 24}, {"x": 12, "y": 49}, | ||
| + | {"x": 13, "y": 87}, {"x": 14, "y": 66}, | ||
| + | {"x": 15, "y": 17}, {"x": 16, "y": 27}, | ||
| + | {"x": 17, "y": 68}, {"x": 18, "y": 16}, | ||
| + | {"x": 19, "y": 49}, {"x": 20, "y": 15} | ||
| + | ] | ||
| + | } | ||
| + | ], | ||
| + | "scales": [ | ||
| + | { | ||
| + | "name": "x", | ||
| + | "type": "linear", | ||
| + | "range": "width", | ||
| + | "zero": false, | ||
| + | "domain": {"data": "table", "field": "x"} | ||
| + | }, | ||
| + | { | ||
| + | "name": "y", | ||
| + | "type": "linear", | ||
| + | "range": "height", | ||
| + | "nice": true, | ||
| + | "domain": {"data": "table", "field": "y"} | ||
| + | } | ||
| + | ], | ||
| + | "axes": [ | ||
| + | {"type": "x", "scale": "x", "ticks": 20}, | ||
| + | {"type": "y", "scale": "y"} | ||
| + | ], | ||
| + | "marks": [ | ||
| + | { | ||
| + | "type": "area", | ||
| + | "from": {"data": "table"}, | ||
| + | "properties": { | ||
| + | "enter": { | ||
| + | "interpolate": {"value": "monotone"}, | ||
| + | "x": {"scale": "x", "field": "x"}, | ||
| + | "y": {"scale": "y", "field": "y"}, | ||
| + | "y2": {"scale": "y", "value": 0}, | ||
| + | "fill": {"value": "steelblue"} | ||
| + | }, | ||
| + | "update": { | ||
| + | "fillOpacity": {"value": 1} | ||
| + | }, | ||
| + | "hover": { | ||
| + | "fillOpacity": {"value": 0.5} | ||
| + | } | ||
| + | } | ||
| + | } | ||
| + | ] | ||
| + | } | ||
| + | </graph> | ||
| + | |||
| + | |||
| + | ---- | ||
| + | |||
| + | Falta implementar a Predefinição: | ||
| + | |||
| + | {{Graph:Chart|width=600|height=100|xAxisTitle=X|yAxisTitle=Y | ||
| + | |type=rect|x=Item 1, Item 2, Item 3, Item 4, Item 5, Item 6, Item 7, Item 8|y=10,12,6,14,2,10,7,9}} | ||
| + | |||
| + | {{Graph:Chart|width=100|height=100|type=pie|legend=Legenda | ||
| + | |x=Item A,Item B,Item C,Item D,Item E,Item F,Item G,Item H,Item I|y1=100,200,150,300,100,100,150,50,200 | ||
| + | |y2=7,8,9,8,8,9,10,9,5|showValues=}} | ||
| + | |||
| + | {{Graph:Chart|width=400|height=100|xAxisTitle=X|yAxisTitle=Y | ||
| + | |legend=Legend|type=stackedarea|x=1,2,3,4,5,6|y1=10,12,6,14,2,10 | ||
| + | |y2=2,4,6,8,13,11|interpolate=monotone|colors=seagreen,orchid}} | ||
Edição das 21h04min de 12 de setembro de 2017
Área de testes
Índice
Links
- Sandbox/Kartographer
- Especial:Páginas especiais
- Especial:Predefinições não categorizadas
- Categoria:Predefinições
Listas:
Sites de interesse
- http://www.datapedia.info/public/cidade/970/square?b=1
- http://cidades.ibge.gov.br/v3/cidades/municipio/3526407
- http://produtos.seade.gov.br/produtos/500anos/index.php?arq_htm=historico/hist_26407.htm
- http://produtos.seade.gov.br/produtos/500anos/index.php?tip=esta
- http://www.imp.seade.gov.br/frontend/#/perfil
Imagens
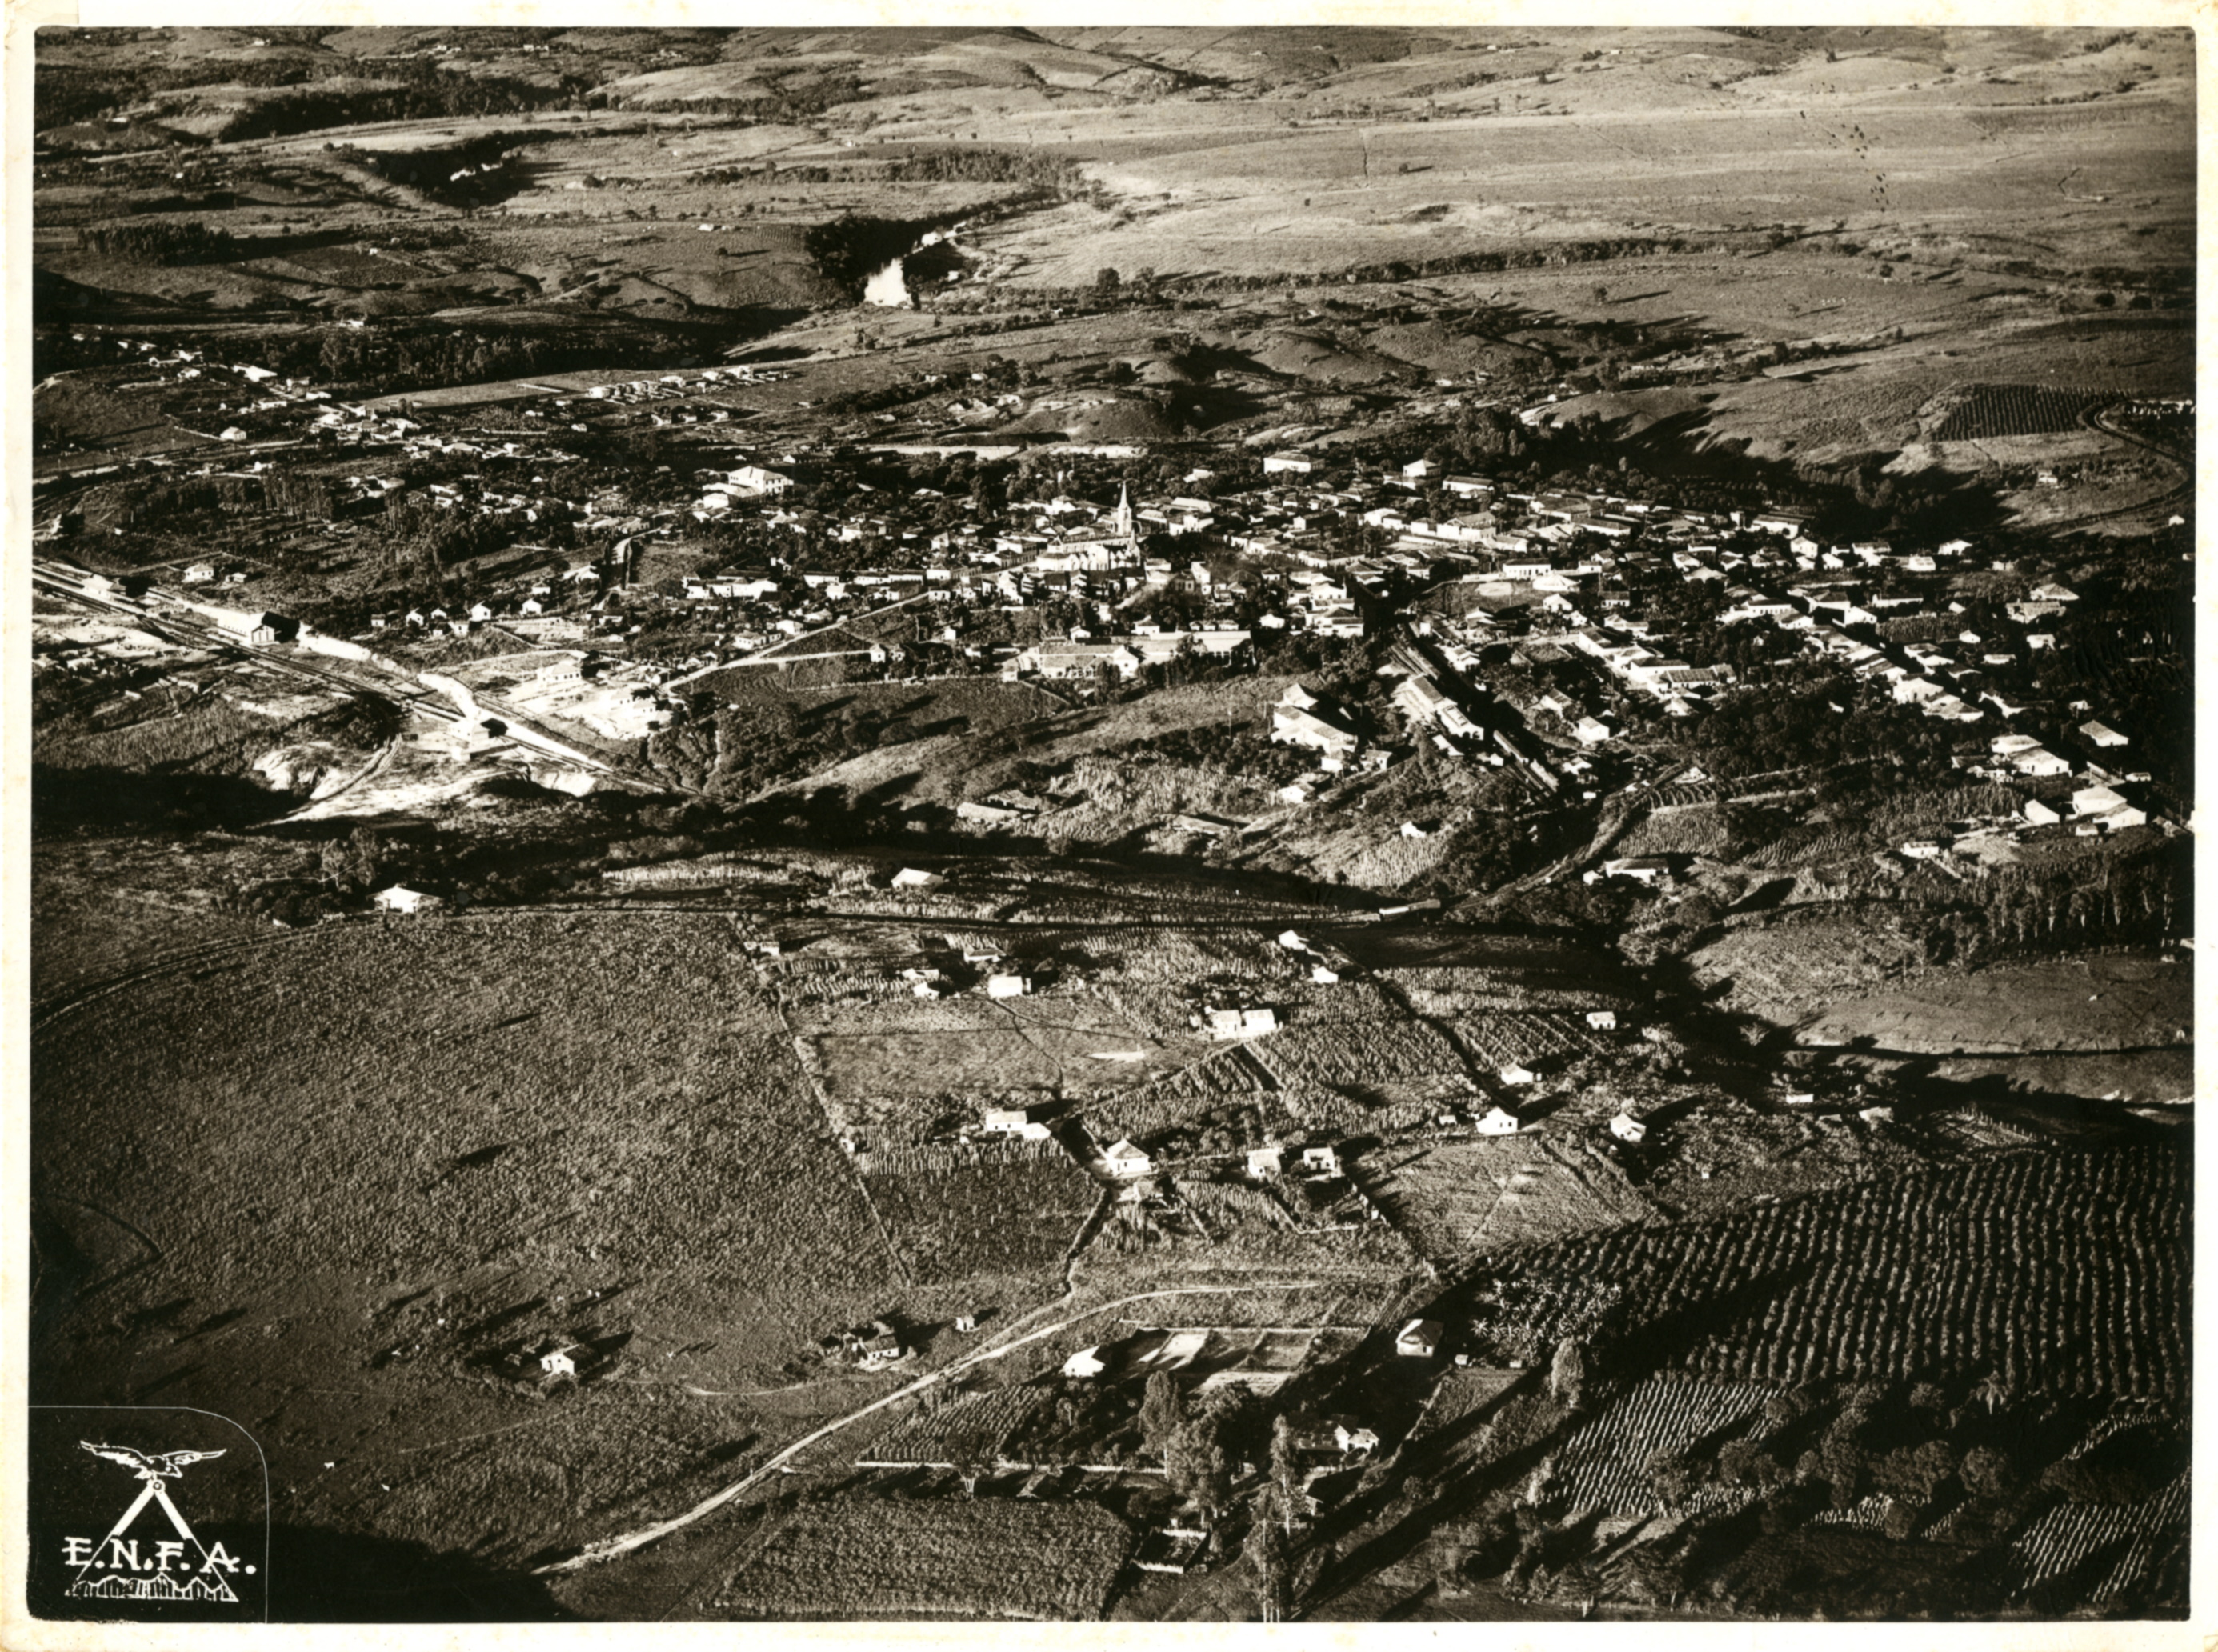
Exemplo de imagem inserida:
Em miniatura, reduzida e com legenda:
ImageMap
Adiciona links na imagem. Parece que a falta de descrição está bugado.
Galerias
Simples:
Galeria - Com legenda mousehover:
Galeria - Modo slideshow:
Tabelas
| Header text | Header text | Header text |
|---|---|---|
| Example | Example | Example |
| Example | Example | Example |
| Example | Example | Example |
| Header text | Header text | Header text |
|---|---|---|
| Example | Example | Example |
| Example | Example | Example |
| Example | Example | Example |
| Header text | Header text | Header text |
|---|---|---|
| Example | Example | Example |
| Example | Example | Example |
| Example | Example | Example |
Gráficos
Teste de gráficos com JSON.
Falta implementar a Predefinição:
Erro de sintaxe
Erro de sintaxe
Erro de sintaxe
Templates
{{Navbox}}
{{Navbar Físico}} {{Navbar Político}} {{Navbar Social}} {{Navbar Econômico}} {{Navbar Histórico}}
Lista de páginas
{{Lista Físico}} {{Lista Político}} {{Lista Social}} {{Lista Econômico}} {{Lista Histórico}}
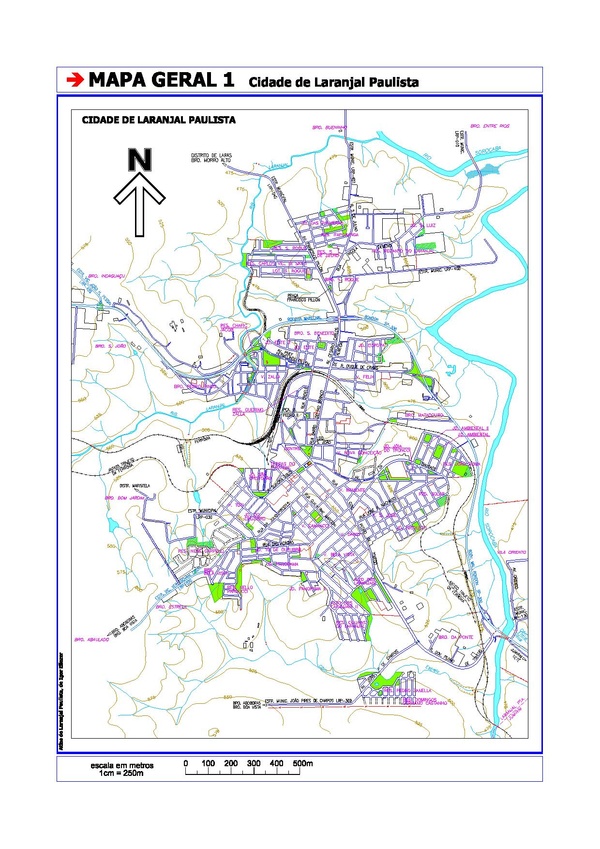
Exemplos de usos com PDFs:
- Download link:
- PDFEmbed (gera um frame):
<pdf width="360" height="500" page="1">Arquivo:MapaLP-teste.pdf</pdf>
- PdfHandler (gera uma imagem):
Extensões
Extensões recomendadas:
- https://www.mediawiki.org/wiki/Extension:Widgets
- http://www.mediawiki.org/wiki/Extension:DynamicPageList_(Wikimedia)
Avisos e caixas de texto
{{Aviso| '''Esta página está incompleta''' Este é um trabalho em andamento. Revisão e correção em estágio inicial.}} {{Página incompleta}} {{Página em revisão}} {{Página completa}} {{Por fazer|Aqui está faltando: * Formatar texto; * Numerar tables; * Limpar dados.}}
| POR FAZER: {{{1}}}
Teste.
|
Ícones:


Emoji úteis: 🗺️ 📍 📌
{{Box|'''Algo:''' Algum texto aqui.}}
Link para modelos: https://www.mediawiki.org/wiki/Template:Ambox


